
Coming to any final conclusion about graphics hardware and how well it will run future VR games and experiences on the basis of one early software sample isn't possible, so let's get that out of the way right now. The results could end up correlating really well with future VR games, or they might be mostly meaningless. We'll have different APIs (LiquidVR, VR Works, and other SDKs), and comparing and contrasting those will require additional tools. But even if we have all of that in a benchmark suite, it still doesn't tell us about the performance of actual VR games.

Consider for a moment the way the SteamVR test works. It shows a scene, which is presumably rendered off-screen in a 2160x1200 window. But since a good VR experience that doesn't make you want to spew is tied to smooth frame rates, we're likely to see a lot of developers take a scalable quality approach. This is what SteamVR does, aiming to break 90 fps at the highest quality settings possible. What that means is rather than seeing one GPU run at 60 fps and a faster GPU run at 120 fps, we're more likely to see one GPU run at the equivalent of medium quality and 100 fps while another might run at 100 fps but with much better quality overall. So how do you even compare cards using this test?
We're going to include three results, as more data tends to be better than less in instances like these. First we'll have the image fidelity score that SteamVR generates—this is the overall average quality of the rendering, which can scale from 1.0 to 11.0. Along with this figure, SteamVR provides the number of frames rendered, but we're more interested in frame rates, so we've captured those and calculated the average fps along with the average of the bottom three percent of frames—what we call the 97 percentile. If the 97 percentile is below 90, it means the particular GPU isn't likely to provide a great VR experience.
PCGAMER Test Setup
Clear as mud? Great! Let's begin, and just for good measure we've tested two different CPUs/systems with our GPU collection, one our usual high-end six-core/twelve-thread Haswell-E processor overclocked to 4.2GHz, and the second a slightly more mainstream quad-core Skylake CPU running at stock 3.9GHz:
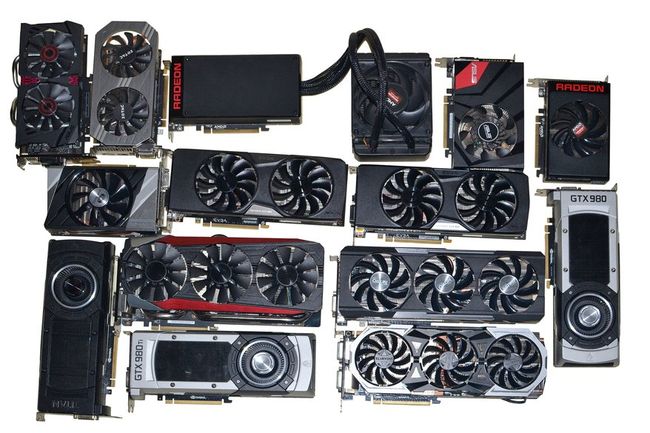
PC Gamer's 2016 GPU Test Bed
CPUs:- Intel Core i7-5930K: 6-core HT OC'ed @ 4.2GHz
Intel Core i5-6600K: 4-core @ 3.9GHz
Mobo:- Gigabyte GA-X99-UD4 (LGA2011 v3)
Mobo:- Gigabyte GA-X99-UD4 (LGA2011 v3)
Asus Z170-A (LGA1151)
GPUs:- AMD R9 Fury X (Reference)
GPUs:- AMD R9 Fury X (Reference)
AMD R9 Fury (Asus)
AMD R9 Nano (Reference)
AMD R9 Nano (Reference)
AMD R9 390 (Sapphire)
AMD R9 380X (Sapphire)
AMD R9 380 (Sapphire)
AMD R9 290X (Gigabyte)
AMD R9 285 (Sapphire)
Nvidia GTX Titan X (Reference)
Nvidia GTX 980 Ti (Reference + Gigabyte)
Nvidia GTX 980 (Reference)
Nvidia GTX 970 (Asus)
Nvidia GTX 960 2GB (EVGA)
Nvidia GTX 950 2GB (Asus + EVGA)
Nvidia GTX 770 2GB (Reference)
SSD:- Samsung 850 EVO 2TB
PSU:- EVGA SuperNOVA 1300 G2
RAM:- G.Skill Ripjaws 16GB DDR4-2666
Cooler:- Cooler Master Nepton 280L
Case:- Cooler Master CM Storm Trooper
OS:- Windows 10 Pro 64-bit
Drivers:- AMD Crimson 16.3.2 Nvidia 364.72
Results Observed
Starting with image fidelity, things are pretty much as expected: Faster GPUs manage higher image fidelity.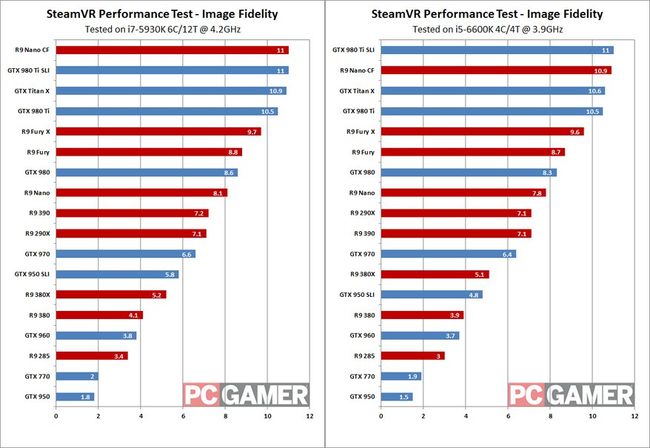
Both AMD and Nvidia fare similarly, at least based on price points, so the R9 Fury and R9 Nano square off against the GTX 980, R9 390 takes on GTX 970, and at the top we have GTX 980 Ti facing off with the R9 Fury X. In the higher performance and higher price segments, Nvidia generally takes a slightly lead, but once prices drop to around $300, AMD's offerings provide better quality. The gap between the GTX 960 and the R9 380X is pretty large, but the GTX 950 vs. R9 380 is really lopsided.
Comparing the overclocked i7-5930K against the stock i5-6600K, the results remain largely the same. We did notice a slight variation between runs on the image fidelity score (+/- 0.1), but it's clear the CPU at least has a minor impact on performance. Interestingly, that applies whether you're looking at an entry-level GTX 950 or a high-end R9 Fury X: you'll generally lose one to three decimals by having a slower CPU. The one exception is the GTX 950 SLI result, where the Core i5 loses a full point on image fidelity. These results can't be considered in a vacuum, however, as we also need to factor in frame rates.
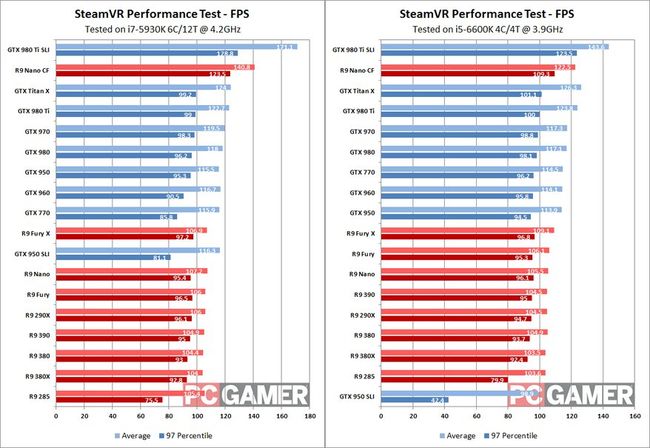
Things are generally about what you'd expect, but there's an odd discrepancy between AMD and Nvidia results. Up until we basically max out the GPUs with CrossFire R9 Nano, the AMD cards all tend to cluster around 105 fps averages, with 97 percentile results in the mid-90s—the one exception being the R9 285, which drops down to 75 fps on its minimums. The Nvidia cards on the other hand all come closer to 115 fps averages, with 97 percentiles again hovering in the low-to-mid 90s. Once we're running two high-end GPUs, we finally max out the image fidelity score, though the single 980 Ti and Titan X at least come close—and they post slightly higher than "normal" frame rates as well.
Shifting to our slower "mainstream" test bed, the results are pretty similar—averages around 105 fps for AMD and 115 for Nvidia. In many cases, the slightly lower image fidelity score allows the frame rates to stay the same, and in a few instances the average fps is even a bit higher. The big exceptions are, not surprisingly, the multi-GPU configurations. GTX 950 SLI shows much worse performance this time, particularly on minimum frame rates. GTX 980 Ti SLI meanwhile still maxes out image quality, but frame rates do drop over 15 percent on average—so a more demanding game would likely have to reduce image quality on a Core i5 processor. And the R9 Nano CrossFire cards aren't quite able to max out image fidelity, with fps again nearly 15 percent lower than on the overclocked i7-5930K.
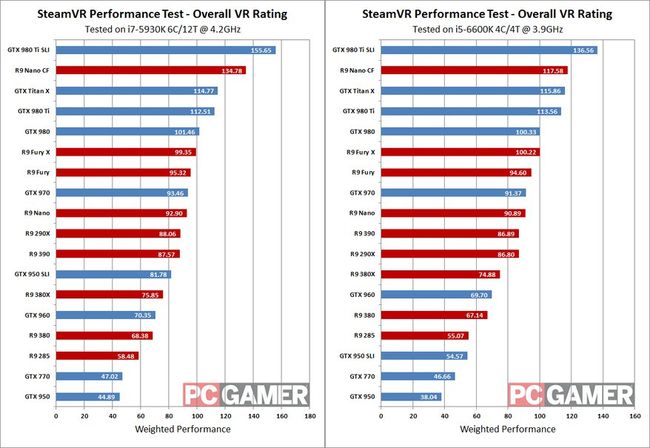
Putting the above results together to provide an overall ranking—and yes, we realize there are many ways to skin this particular beast, and you may or may not agree with our weighting calculation—we end up with these final charts. Outside of dual-GPU configurations taking a dive on the Core i5 setup, most of the results are pretty close, and in fact there are a few instances where our final weighting gives the i5 platform a win. Don't read too much into that, but it makes sense that overall we're not hugely CPU limited, at least not with what are admittedly "fast" and "very fast" CPUs. It might be interesting to see what happens with a lower performance Core i3 processor, or one of AMD's APUs, but we'll save that for another day.
No comments:
Post a Comment